


Abstract
There is limited available information on patterns of utilization and efficacy of alternative medicine (AM) for patients with cancer. We identified 281 patients with nonmetastatic breast, prostate, lung, or colorectal cancer who chose AM, administered as sole anticancer treatment among patients who did not receive conventional cancer treatment (CCT), defined as chemotherapy, radiotherapy, surgery, and/or hormone therapy. Independent covariates on multivariable logistic regression associated with increased likelihood of AM use included breast or lung cancer, higher socioeconomic status, Intermountain West or Pacific location, stage II or III disease, and low comorbidity score. Following 2:1 matching (CCT = 560 patients and AM = 280 patients) on Cox proportional hazards regression, AM use was independently associated with greater risk of death compared with CCT overall (hazard ratio [HR] = 2.50, 95% confidence interval [CI] = 1.88 to 3.27) and in subgroups with breast (HR = 5.68, 95% CI = 3.22 to 10.04), lung (HR = 2.17, 95% CI = 1.42 to 3.32), and colorectal cancer (HR = 4.57, 95% CI = 1.66 to 12.61). Although rare, AM utilization for curable cancer without any CCT is associated with greater risk of death.
Delay or refusal of conventional cancer treatment (CCT), when done in favor of alternative medicine (AM), may have serious survival implications for cancer patients (1–7). However, there is limited research evaluating the use and effectiveness of AM, partly due to data scarcity or patient hesitance to disclose nonmedical therapy to their providers (8,9). To address this knowledge gap, we used the four most prevalent cancers (breast, prostate, lung, and colorectal) in the United States (10) from the National Cancer Database between 2004 and 2013 to identify the factors associated with AM selection and compared survival outcomes between AM and CCT.
Patients who underwent AM were identified as those coded as “other-unproven: cancer treatments administered by nonmedical personnel” and who also did not receive CCT, defined as chemotherapy, radiotherapy, surgery, and/or hormone therapy. Patients with metastatic disease at diagnosis, stage IV disease based on the American Joint Commission on Cancer (AJCC) staging system (11), receipt of upfront treatment with palliative intent, and unknown treatment status or clinical or demographic characteristics were excluded.
Demographic and clinical factors were evaluated using the chi-square test and the t test for categorical and continuous variables, respectively. Independent associations with AM use (vs CCT alone) were identified using multivariable logistic regression. Two-to-one nearest-neighbor propensity score matching without replacement was performed to compare overall survival (OS). Univariate survival analyses were completed using the Kaplan-Meier estimator, log-rank test, and Cox proportional hazards regression. Variables with P value of .10 or less on univariate analyses were entered into a multivariable Cox proportional hazards survival model using forced entry for the 2:1 matched sample. The assumption of proportionality was verified graphically using log-log survival plots. All statistical tests were two-sided, and a P value of less than .05 was considered statistically significant.
We identified 281 cancer patients who chose AM in lieu of CCT. Patient characteristics between AM and CCT are shown in Supplementary Table 1 (available online). Notably, patients in the AM group were more likely to be younger, to be female, to have a lower Charlson-Deyo Comorbidity Score (CDCS), and to have higher cancer stage, income, and education. In multivariable analysis, when controlling for clinical and demographic factors, patients undergoing AM were more likely to have breast (odds ratio [OR] = 2.56, 95% confidence interval [CI] = 1.40 to 4.68) or lung (OR = 3.16, 95% CI = 1.85 to 5.40) cancer (vs prostate), higher education (OR = 1.46, 95% CI = 1.02 to 2.08), Intermountain West (OR = 3.09, 95% CI = 1.81 to 5.29) or Pacific (OR = 3.16, 95% CI = 2.10 to 4.74) regions of residence, stage II (OR = 3.31, 95% CI = 2.21 to 4.95) or III (OR = 3.87, 95% CI = 2.47 to 6.07) disease, and a lower CDCS (Supplementary Table 2, available online).
Following 2:1 matching, 560 patients who received CCT were matched to 280 patients who received AM based on cancer type, age, clinical group stage, CDCS, insurance type, race, and year of diagnosis; a total of 840 patients were analyzed. There were no statistically significant differences in matched characteristics (chi-square or t test, all P > .10). The median follow-up was 66 months. On matched univariate survival analysis, AM was associated with worse five-year survival (54.7%, 95% CI = 47.5% to 61.3%, vs 78.3%, 95% CI = 74.2% to 81.8%, log-rank P < .001; hazard ratio [HR] = 2.21, 95% CI = 1.72 to 2.83) (Figure 1A) and remained an independent predictor of greater risk of death (HR = 2.50, 95% CI = 1.88 to 3.27) when controlling for clinical and sociodemographic factors (Table 1). When stratified by cancer type, receipt of AM was associated with statistically significantly worse five-year survival for breast 58.1%, 95% CI = 46.0% to 68.5%, vs 86.6%, 95% CI = 80.7% to 90.7%, P < .001; HR = 5.68, 95% CI = 3.22 to 10.04), lung (19.9%, 95% CI = 9.9% to 32.4%, vs 41.3%, 95% CI = 31.1% to 51.2%, P < .001; HR = 2.17, 95% CI = 1.42 to 3.32), and colorectal cancer (32.7%, 95% CI = 15.8% to 50.8%, vs 79.4%, 95% = CI 66.3% to 87.8%, P < .001; HR = 4.57, 95% CI = 1.66 to 12.61), but not for prostate cancer (86.2%, 95% CI = 73.9% to 92.9%, vs 91.5%, 95% CI = 84.7% to 95.4%, P = .36; HR = 1.68, 95% CI = 0.68 to 4.17) (Figure 1, B–E) on univariate and multivariable analyses.
Cox-regression of covariates associated with overall survival
| Variables | Univariate | Multivariable* | ||
|---|---|---|---|---|
| HR (95% CI) | P† | HR (95% CI) | P† | |
| Treatment type | ||||
| Conventional | 1.00 (reference) | 1.00 (reference) | ||
| Alternative | 2.21 (1.72 to 2.83) | <.001 | 2.50 (1.88 to 3.27) | <.001 |
| Age | 1.02 (1.01 to 1.03) | <.001 | 1.01 (0.99 to 1.03) | .16 |
| Cancer type | ||||
| Prostate | 1.00 (reference) | 1.00 (reference) | ||
| Breast | 2.48 (1.59 to 3.87) | <.001 | 2.34 (1.42 to 3.87) | .001 |
| Lung | 11.80 (7.70 to 18.08) | <.001 | 6.52 (3.83 to 11.10) | <.001 |
| Colorectal | 3.73 (2.23 to 6.26) | <.001 | 2.62 (1.42 to 4.85) | .002 |
| Sex | ||||
| Male | 1.00 (reference) | — | — | |
| Female | 1.20 (0.93 to 1.56) | .15 | — | — |
| Race | ||||
| White | 1.00 (reference) | 1.00 (reference) | ||
| Black | 0.70 (0.45 to 1.09) | .08 | 0.65 (0.36 to 1.18) | .16 |
| Hispanic | 0.40 (0.18 to 0.91) | .03 | 0.11 (0.01 to 0.77) | .03 |
| Other | 0.40 (0.18 to 0.90) | .03 | 0.25 (0.07 to 0.85) | .03 |
| Income‡ | ||||
| <$48 000 | 1.00 (reference) | — | — | |
| ≥$48 000 | 1.05 (0.80 to 1.37) | .74 | — | — |
| Education§ | ||||
| <80% HSE | 1.00 (reference) | — | — | |
| ≥80% HSE | 1.00 (0.77 to 1.31) | .86 | — | — |
| Residence setting | ||||
| Metropolitan | 1.00 (reference) | — | — | |
| Nonmetropolitan | 1.13 (0.79 to 1.63) | .51 | — | — |
| Geographic area | ||||
| Northeast | 1.00 (reference) | — | — | |
| South Atlantic | 0.96 (0.62 to 1.46) | .96 | — | — |
| Midwest | 1.25 (0.85 to 1.84) | .40 | — | — |
| South | 1.01 (0.62 to 1.66) | .98 | — | — |
| Intermountain West | 1.04 (0.58 to 1.88) | .60 | — | — |
| Pacific | 1.15 (0.75 to 1.75) | .97 | — | — |
| Insurance type | ||||
| None | 1.00 (reference) | 1.00 (reference) | ||
| Private | 0.72 (0.41 to 1.28) | .15 | 0.96 (0.44 to 2.13) | .93 |
| Medicaid | 1.78 (0.87 to 3.63) | .27 | 1.40 (0.54 to 3.62) | .48 |
| Medicare | 1.13 (0.64 to 2.03) | .68 | 1.12 (0.49 to 2.60) | .78 |
| Government/unknown | 0.18 (0.06 to 0.55) | .007 | 0.40 (0.11 to 1.37) | .14 |
| Facility type | ||||
| Community | 1.00 (reference) | 1.00 (reference) | ||
| Academic | 1.42 (1.05 to 1.91) | .02 | 1.22 (0.90 to 1.64) | .21 |
| Clinical stage | ||||
| I | 1.00 (reference) | 1.00 (reference) | ||
| II | 0.82 (0.55 to 1.22) | .34 | 1.37 (0.87 to 2.16) | .17 |
| III | 3.76 (2.59 to 5.46) | <.001 | 2.68 (1.78 to 4.04) | <.001 |
| Charlson-Deyo Comorbidity | ||||
| 0 | 1.00 (reference) | 1.00 (reference) | ||
| 1 | 2.32 (1.63 to 3.32) | <.001 | 1.32 (0.88 to 1.97) | .18 |
| ≥2 | 3.82 (1.88 to 7.77) | <.001 | 1.08 (0.48 to 2.44) | .86 |
Variables included in the multivariable model include treatment type, age, cancer type, race, insurance type, facility type, clinical stage, and Charlson-Deyo Comorbidity. — designates terms not included in the model. CI = confidence interval; HR = hazard ratio; HSE = high school education.
P values were calculated by a two-sided Cox proportional hazards regression.
Income is expressed as median household income by ZIP code of residence.
Education is expressed as the percentage of residents by ZIP code receiving a high school education.
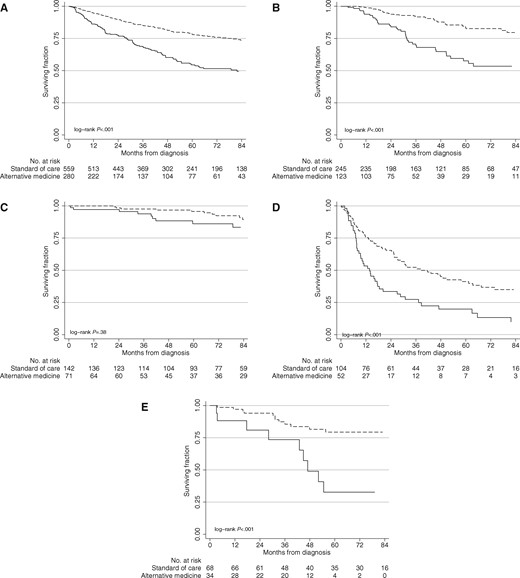
Overall survival of patients receiving alternative medicine (solid lines) vs conventional cancer treatment (dashed lines). Overall survival of alternative medicine vs conventional cancer treatment for (A) all patients, (B) breast, (C) prostate, (D) lung, and (E) colorectal cancers. P values were calculated by a two-sided log-rank test.
Patients who initially chose AM for treatment of curable cancer in lieu of CCT were rare and had statistically significantly worse survival. After controlling for sociodemographic and clinical factors, the magnitude of difference was largest for breast cancer because women who used AM as initial treatment without CCT had more than a fivefold increased risk of death. Patients with colorectal and lung cancer had a more than fourfold and twofold increase in risk of death, respectively. Notably, there was no statistically significant association between AM use and survival for patients with prostate cancer. This is not unexpected, given the long natural history of prostate cancer and the short median follow-up in this study. Among our study population, approximately 74.6% of prostate cancer patients had low- to intermediate-risk disease, a subgroup with level 1 evidence showing no difference in risk of death when comparing observation with surgery or radiotherapy and hormone therapy at 10 years (12).
It is important to note that complementary and integrative medicine are not the same as AM as defined in our study (13). Whereas complementary and integrative medicine incorporate a wide range of therapies that complement conventional medicine, AM is an unproven therapy that was given in place of conventional treatment. As there is limited evidence of patients who chose AM as the primary treatment for their cancer, accurate comparisons between our cohort and other studies remain difficult. However, there are several important similarities between AM use characteristics and those who seek complementary cancer therapies, including younger age, breast cancer, higher education and income, Pacific region, and more advanced stage (9,14–16).
One important limitation of our analysis is its observational nature, which may have underascertained the use of CCT for patients who received treatment at another facility or patients who initially received AM prior to presenting to a data-collecting facility. However, these underreported or late presentations would have likely biased our study toward the null (ie, lack of survival difference), making our findings potentially more clinically meaningful. Other limitations of the data include unmeasured confounders or selection bias that could impact survival. However, because patients receiving alternative medicine were more likely to be younger, more affluent, more well-educated, and less burdened with comorbidities, this would not likely account for the observed survival differences. Last, we lack information regarding the type of alternative therapies delivered, though there is limited to no available evidence that specific AM therapies have been shown to improve cancer survival.
In conclusion, we found that cancer patients who initially chose treatment with AM without CCT were more likely to die. Improved communication between patients and caregivers and greater scrutiny of the use of AM for the initial treatment of cancer is needed.
Notes
The American College of Surgeons and the Commission on Cancer have not verified and are not responsible for the results herein. This study was granted exemption by the Yale Human Investigations Committee. Skyler B. Johnson, MD, has no relevant financial interests, activities, relationships, or affiliations. Henry S. Park, MD, MPH, has received honoraria from Varian Medical Systems, Inc., and RadOncQuestions, LLC. Cary P. Gross, MD, receives research funding from 21st Century Oncology, Johnson and Johnson, Medtronic, and Pfizer. James B. Yu, MD, MHS, receives research funding from 21st Century Oncology.
The authors would like to acknowledge Yi An, MD, Trevor Bledsoe, MD, Benjamin Kann, MD, Jacqueline Kelly, MD, MSc, Adam Kole, MD, PhD, Nataniel Lester-Coll, MD, and John Stahl, MD, for their contributions to data collection. The above acknowledged are affiliated with The Department of Therapeutic Radiology at Yale School of Medicine and have no conflicts of interest to disclose.

